How to track QR code scans
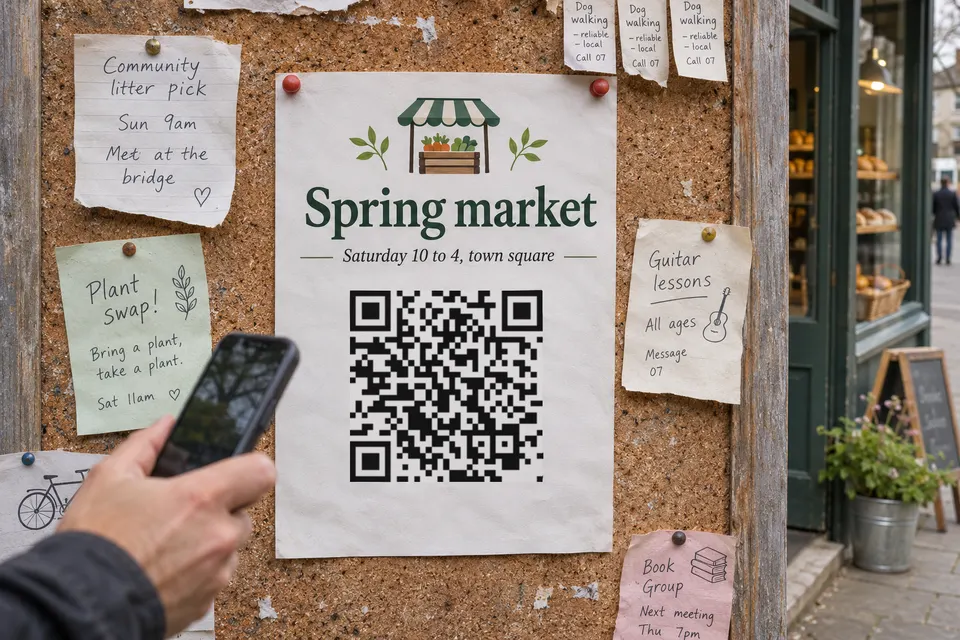
A QR code can be tracked only if a counting service or your own analytics sits behind its address. There are two ways: use a dynamic code, whose service counts each time the address is opened, or point the code to your own web page and let your web analytics count the visit. The printed pattern itself counts nothing, so a code that holds plain text or WiFi details cannot be tracked at all.
Already printed? Scan the code and look at the address it opens. If it is a service address, the numbers are in that service’s dashboard. If it is a page on a website you control, you can start measuring visits now without reprinting. If the printed address has no campaign tags and is also used elsewhere, the numbers will mix QR visits with other traffic; a page that only this code leads to keeps them apart. Tracking that starts today does not bring back earlier scans.
Way 1: let the QR code service count
- Create the code with a service and check that the plan you intend to use includes scan counts.
- Print the code and scan one printed copy yourself to check that it opens the right page.
- Open the service’s dashboard and read the count. Leave your own test scans out of the comparison, or note how many you made.
With bebber, create a bebber in the creator and confirm your email address. The edit link you receive shows no statistics.
For the numbers, open the account sign-in, enter the email address you used for the bebber and choose “Send me a link”. Follow the link in that email. In the dashboard, choose “Add it”, or “Add all” when several bebbers are offered.
A free account shows the all-time total and the unique scans of today, the last 7 days and the last 30 days. Pro adds the chart per day, the country and city, the device and a CSV export; the QR code tracking page lists what each plan shows.
Way 2: count the visit on your own website
If the code leads to a page on your own website, your web analytics can count the visit. To tell QR visitors apart from everyone else, put campaign parameters into the address before you make the code. The steps below use Google Analytics, which must already be installed and collecting data on the page.
- Take the address of your page and add UTM parameters, for example
https://example.com/menu?utm_source=flyer&utm_medium=qr&utm_campaign=spring. Google’s instructions for campaign URLs say you should always useutm_source,utm_mediumandutm_campaign. - Make a QR code for that full address. A static code is enough, because the counting happens on your page.
- Print the code, scan it once and check that your page opens with the parameters in the address.
- In Google Analytics, open Reports, then Acquisition, then Traffic acquisition. Choose the dimension “Session source / medium”, find the row
flyer / qrand read its Sessions for your campaign dates. Google describes the report in its Traffic acquisition help page.
This way needs no QR service, and the code depends only on your own page. The number you read is sessions, which are visits and not scans: a person who scans twice in a short time can be one session. Analytics that runs in the browser can also miss visits when a visitor blocks it.
A longer address can need more squares in the pattern. At the same printed size the squares get smaller, so test the code at the size you plan to print. DENSO WAVE’s QR Code version page shows how the number of squares grows with the amount of data.
A dynamic code keeps the printed address short. With bebber, choose “Just want to link to a website?” in the creator, paste your full tagged address under “Where should this QR send people?” and continue through the preview and email steps. This kind of bebber is free: it counts the scan and then sends the visitor on to your address. UTM parameters you type in yourself work on the free plan; on Pro and Business, bebber can add them for you.
What a scan count tells you and what it does not
- It counts opens of the address, not people. The same person scanning on two different days counts twice.
- bebber also reports unique scans: one per device and network within 30 minutes.
- Opening the link without a camera counts too, and so can automated visits. bebber does not filter out a messenger that loads a link preview.
- It does not tell you which printed copy was scanned. To compare two flyers or two locations, print a different code on each.
- It does not tell you who scanned. On Pro and Business, bebber shows an estimated country and city, the device type, the browser and the phone’s language. These statistics do not identify the person or show an exact position.
Compare two flyers, posters or places
Make one code per version and give each a name you will recognise, such as “Flyer A, market stall” and “Flyer B, letterboxes”. Both can show the same content. After the campaign, compare the unique scans over the same period.
For Google Analytics, keep the source and medium the same and give each code its own campaign value, for example utm_campaign=flyer_a and utm_campaign=flyer_b. In Traffic acquisition, choose the dimension “Session campaign” and compare the Sessions of the two rows over the same dates. These are sessions, not unique scans.
Check before you print
A printed code is hard to track afterwards. If it points to a page you cannot change and whose analytics you cannot see, ask the website’s owner for visit figures. An address without tags that other visitors also use will not show the QR visits on their own. If you are not sure which kind of code you need, static vs dynamic QR code compares the two, and do QR codes expire covers what to check in a service’s terms.
Sources
- instructions for campaign URLs support.google.com
- Traffic acquisition help page support.google.com
- QR Code version page qrcode.com
Read next
Static vs dynamic QR code: which one do you need to print?
A static QR code holds the content itself, a dynamic one holds a service's address. See what each can change and count, and which one to print.
Do QR codes expire? What seven tools say, and what bebber does
Do printed QR codes expire? Compare seven tools' stated policies, check your own code, and see what you can fix before reprinting.
How big a QR code sign needs to be so people scan it
QR code sign size: start at the scanning distance divided by 10. Size table for counters, windows and yard signs, glare, placement, tamper checks.
Ready to make one that lasts?
Free, no account, and the code keeps working.
Create your bebberNo sign-up. No credit card. Free forever.